x축 라벨 날짜(date) 마이크로초 단위 나올 때 해결법
Updated:
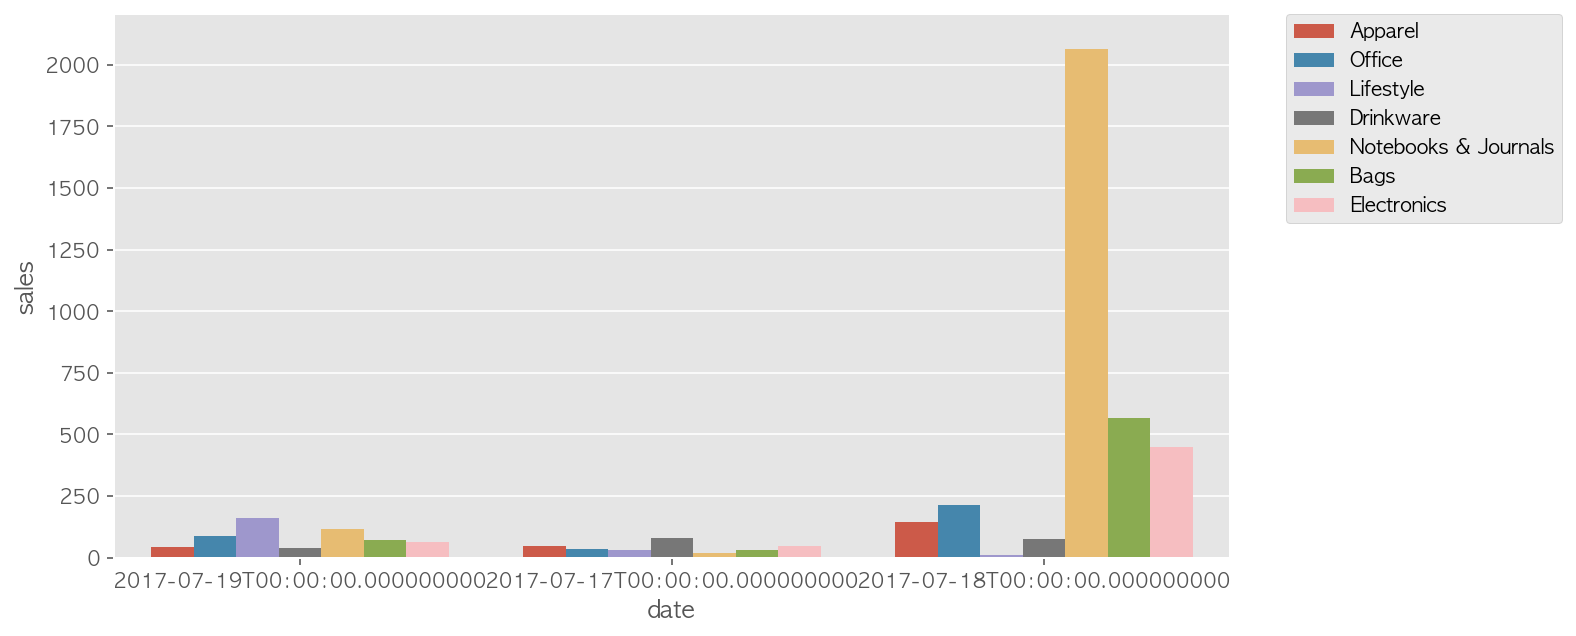
- x축을 날짜로 그래프를 그릴 때 datetime의 마이크로초단위까지 모두 노출되는 경우가 있다.
- 데이터프레임을 확인해보면
%Y-%m-%d포멧이다.
plt.figure(figsize = (10,5))
sns.barplot(data = df, x = 'date', y = 'sales', hue = 'category', ci = False)
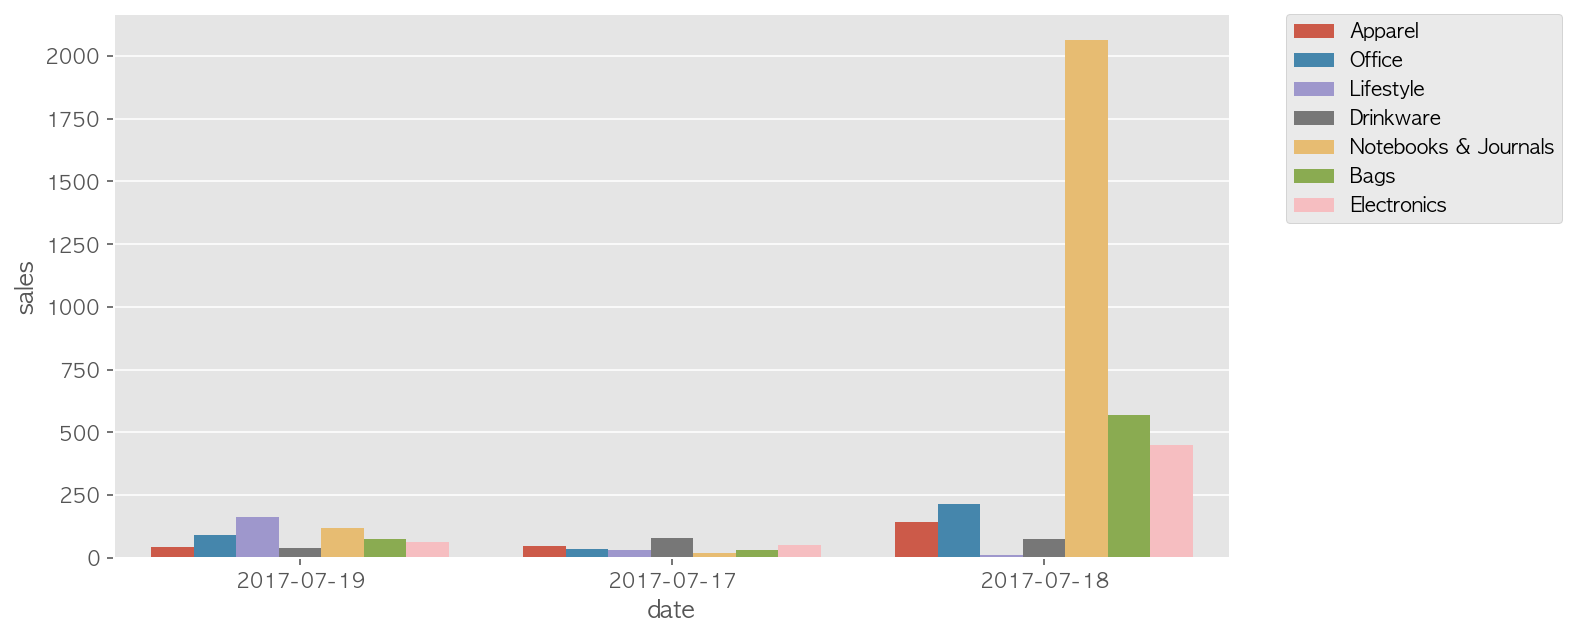
plt.figure(figsize = (10,5))
# 플롯을 g에 할당해준다.
g = sns.barplot(data = df, x = 'date', y = 'sales', hue = 'category', ci = False)

# xticklabels 가져와서 T로 나눠 앞 요소만 출력하는 반복문 실행
g.set_xticklabels([date_text.get_text().split("T")[0] for date_text in g.get_xticklabels()])
참고링크
https://stackoverflow.com/questions/62480198/date-format-changed-using-seaborn-pointplot